Software for Windows
Science with your Sound Card!


Features:
Oscilloscope
Spectrum Analyzer
8-Channel
Signal Generator
Spectrogram
Pitch Tracker
Pitch-to-MIDI
DaqMusiq Generator
(Free Music... Forever!)
Engine Simulator
LCR Meter
Remote Operation
DC Measurements
True RMS Voltmeter
Sound Level Meter
Frequency Counter
Period
Event
Spectral Event
Temperature
Pressure
MHz Frequencies
Data Logger
Waveform Averager
Histogram
Post-Stimulus Time
Histogram (PSTH)
THD Meter
IMD Meter
Precision Phase Meter
Pulse Meter
Macro System
Multi-Trace Arrays
Trigger Controls
Auto-Calibration
Spectral Peak Track
Spectrum Limit Testing
Direct-to-Disk Recording
Accessibility
Data Logger
Waveform Averager
Histogram
Post-Stimulus Time
Histogram (PSTH)
THD Meter
IMD Meter
Precision Phase Meter
Pulse Meter
Macro System
Multi-Trace Arrays
Trigger Controls
Auto-Calibration
Spectral Peak Track
Spectrum Limit Testing
Direct-to-Disk Recording
Accessibility
Applications:
Frequency response
Distortion measurement
Speech and music
Microphone calibration
Loudspeaker test
Auditory phenomena
Musical instrument tuning
Animal sound
Evoked potentials
Rotating machinery
Automotive
Product test
Contact us about
your application!
Full-Scale Range - DaquinOscope Method
Controls: Calibration Menu >> Full-Scale Range
Introduction:
This approach to Full-Scale Range calibration involves measuring the Generator output separately and using that to set the Output Range, then applying the now-calibrated signal to the input to get the Input Range. However, unlike the Output Voltage Method, it does not require a sensitive conventional AC voltmeter.
Instead, it uses an inexpensive Arduino board with a simple AC-to-DC Input Level Shifter and Limiter. Using this setup with the DaquinOscope macro mini-app allows direct measurement of the peak-to-peak voltage of the sound card output. It relies on the fact that the Arduino ADCs (Analog to Digital Converters) are referenced to the +5 V supply, which is usually fairly accurate and can easily be measured with an inexpensive meter. (Such meters usually have a 19.99 V DC range, but the most sensitive AC range is usually 199.9 Vrms.)
Note: You must have previously run Auto-Calibrate for the output and input lines whose range you want to set; otherwise, their controls will be disabled in the Full-Scale Range dialog.
In addition, you should also perform input and output impedance measurements on your card, since these values will be used to correct the calibration.
Arduino Setup:
The idea is that the AC output of the sound card will have about 2.5 V DC added by the AC-to-DC Input Level Shifter and Limiter, so it will then be in the 0 to +5 V DC range which the Arduino can measure. With DaquinOscope you can read the peak-to-peak values from Daqarta using the Voltmeter or the cursor readouts in Delta mode.
For most accurate results, you should use high resistances in the AC-to-DC circuit. 1 Megohm is a good choice.
If you haven't used your Arduino with Daqarta yet, make sure to upload the DaqPort sketch to the board.
Disconnect the Arduino from the USB socket on your computer, then connect the AC-to-DC circuit:
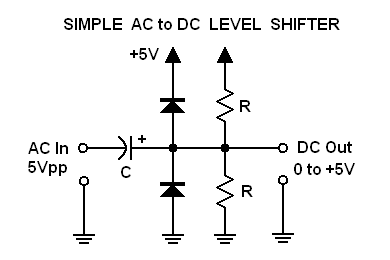
The +5V and ground connections on the circuit go to the 5V and GND connections on the Arduino. DC Out goes to A0 on the Arduino, and AC In goes to the sound card output. You can use mini-gator clip leads to the end of a male-male cable plugged into the output.
Finding Output Range:
Now plug the Arduino into the computer USB socket. Start Daqarta and load the Daqarta Generator with the Default.GEN setup, which creates a 440 Hz Sine output. Hit the F9 key to open the Volume Slider dialog and set the level to maximum. Double-check to make sure it is unmuted (default), but leave the main Generator button off.
Hit CTRL+F8 to open the Macro Dialog, click on DaquinOscope, then click the Macro Run Button. You may see a "Waiting for Arduino init..." message for a couple of seconds. When you are prompted to open the DscopeSetup file, hit ESC or click on Cancel.
The DaquinOscope - Main Controls dialog will appear. Toggle the main Generator button on, and you should see its output trace in green, along with the DaquinOscope trace in yellow. The traces will be rolling, so click the Trigger button in DaquinOscope, not the main Trigger button in the toolbar, which DaquinOscope will activate itself.
The DaquinOscope default is to acquire 8-bit ADC data for speed, but here we want 10-bit for higher resolution. Click the More Controls >>> button at lower right and the DaquinOscope - Trigger Timing dialog will appear, with the button you just clicked now labeled Osc and Misc Controls >>>. Click that button again to get to the DaquinOscope - Oscillators and Misc dialog. At the bottom left, click the 8 ADC Bits button once to get to 10 ADC Bits.
To make the measurement, hit the ALT+V key combo to open the Daqarta Voltmeter. Click the Ch0 channel button at the left end to select the DaquinOscope source, then click the Pk-Pk button to set Peak-to-Peak mode.
Note that you can't use RMS mode here. The signal we are measuring has had +2.5 VDC added to it by the AC-to-DC circuit. That doesn't affect the peak-to-peak value, but it does affect the true RMS value which the Voltmeter reads.
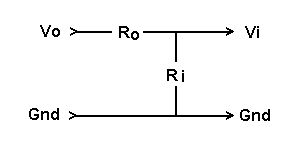
Divide the peak-to-peak value from the Voltmeter by 2 to get the equivalent 0-to-peak value of the AC signal. However, that doesn't consider the sound card output and Arduino input impedances. We want the no-load sound card output voltage Vo, but it has been reduced by the voltage divider formed by the output impedance Ro and the Arduino input impedance Ri to give the Vi input voltage we measured:
The measured value is thus:
Vi = Vo * Ri / (Ro + Ri)
Since we want Vo we rearrange this to get
Vo = Vi * (Ro + Ri) / Ri
Now Vo is the true no-load output voltage. Go to the Calibration menu and click Full-Scale Range, then enter the Vo value in the Wave Out control at the bottom.
There is one case where the above approach won't work directly: If the maximum sound card output is greater than about +/-2.5 V, then it would be clipped by the AC-to-DC circuit and you'd see a distorted sine wave. The fix is to simply reduce the volume slightly until the distortion is no longer detected. Record the dB value from the volume slider, which is the reduction from the maximum 0 dB value.
Then, as above, you take half of the Voltmeter Pk-Pk value to get the 0-to-leak voltage Vi seen by DaquinOscope, and find the apparent Vo via Vo = Vi * (Ro + Ri) / Ri as before.
To find the Wave Out value, we divide the above Vo by the attenuation, expressed as a decimal fraction, which is 10^(dB / 20). For example, suppose you had to reduce the volume from 0 dB to -2.5 dB. The fraction is then 10^(-2.5 / 20) = 10^(-0.125) = 0.74989, so Wave Out is Vo / 0.74989.
Finding Input Range:
To complete the full-scale range calibration, proceed to Finding Input Range under Full-Scale Range - Output Voltage Method.
See also Full-Scale Range Dialog, Full-Scale Range - Output Voltage Method, Input Voltage Method, Polarity Determination, Calibration Menu
- Back to Full-Scale Range - Output Voltage Method
- Ahead to Full-Scale Range - Input Voltage Method
- Daqarta Help Contents
- Daqarta Help Index
- Daqarta Downloads
- Daqarta Home Page
- Donate to Daqarta
Questions? Comments? Contact us!
We respond to ALL inquiries, typically within 24 hrs.INTERSTELLAR RESEARCH:
Over 45 Years of Innovative Instrumentation
© Copyright 2007 - 2026 by Interstellar Research
All rights reserved